Healing Oasis Eye & Vision Charts
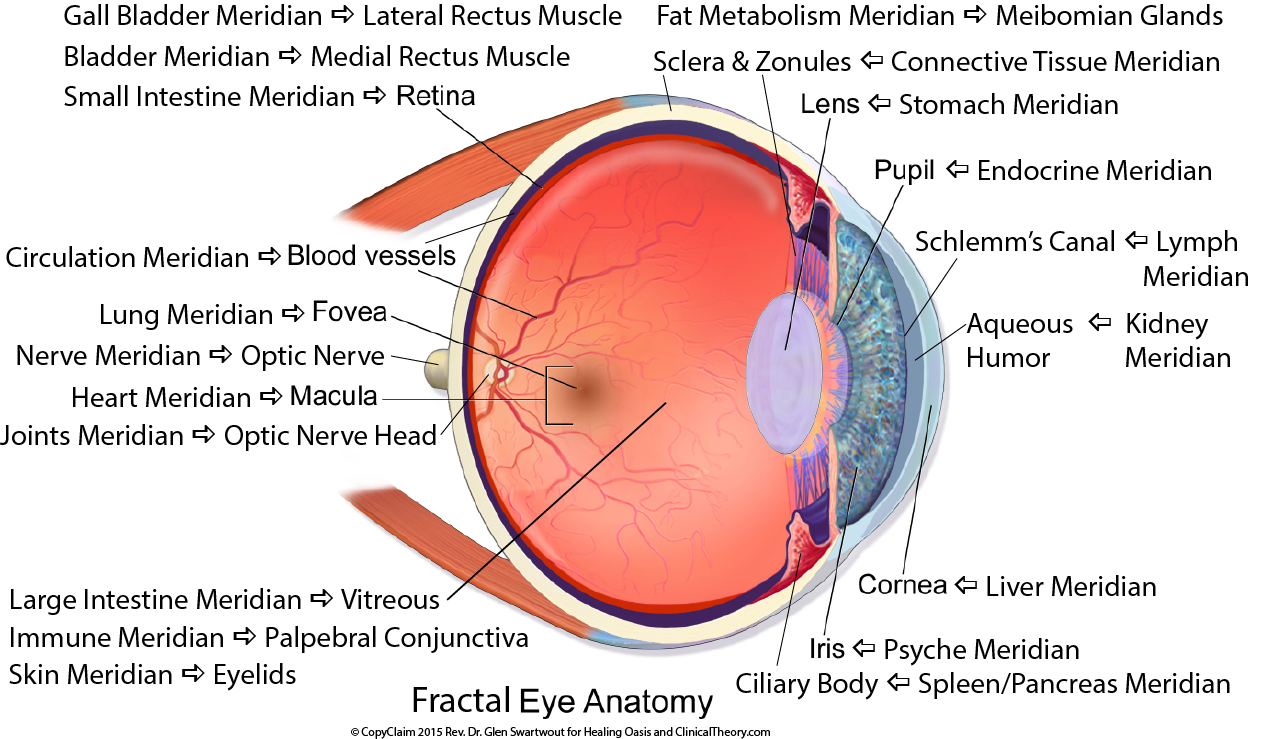
This infographic illustrates the links of all 20 electroacupuncture meridians to the various segments of the eye...
The eye is the dominant photovoltaic cell that charges the brain-liver dipole battery, as discovered by Naturopathic Optometrist, Dr. Spitler, at the College of Syntonic Optometry...
We now know that the retina has the strongest electrical dipole power of any body tissue...
This battery power of charge separation initiated by light is the primary power source that runs the direct current meridian system which is the logistics, communication, nourishment and detoxification pathway unique to the connective tissue...
The connective tissue is where every cell lives...
Even cancer cells placed in healthy connective tissue do not form tumors...
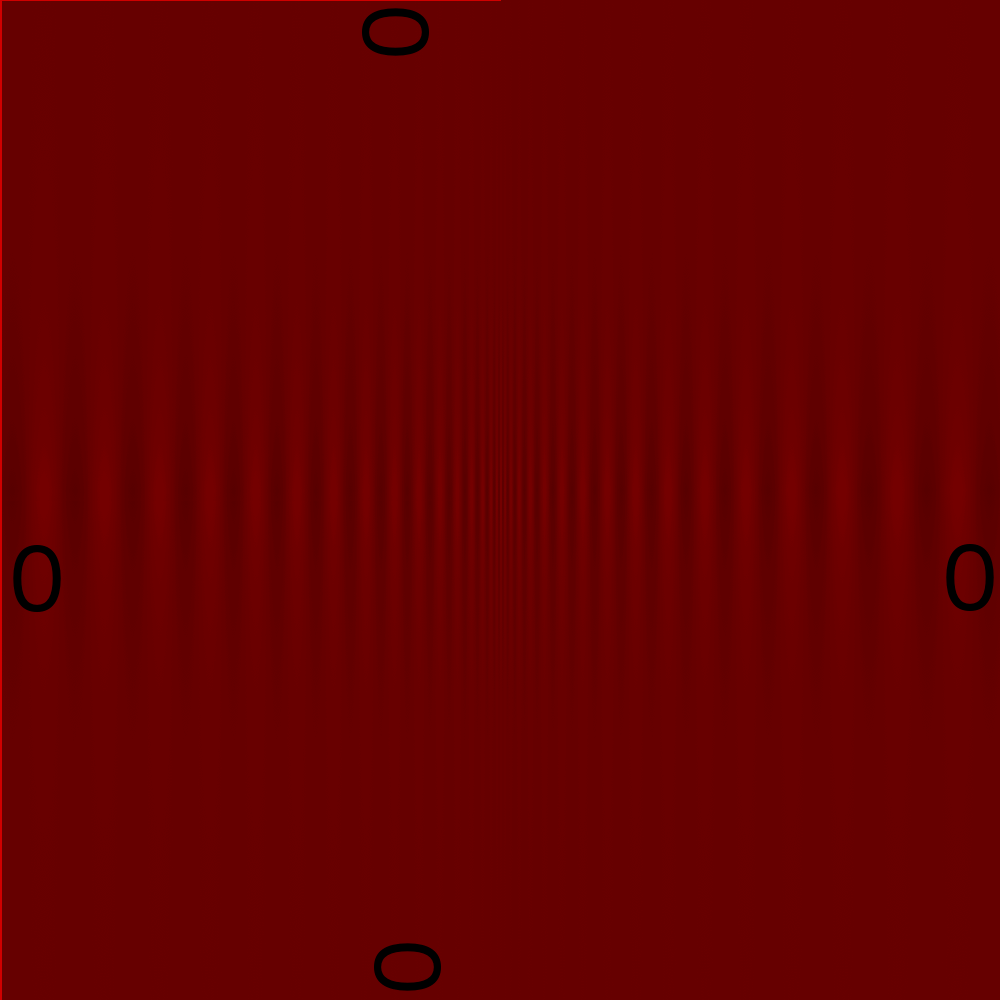
Contrast sensitivity provides a way of assessing visual function that is more sensitive than conventional targets...
Rev. Dr. Glen Swartwout has developed these charts for clinic and home monitoring of central visual function and macular health...
Both the neutral gray and the red chart are marked on each of the four sides with an "O" that can be used to standardize the viewing distance...
Simply look continuously at the center of the chart with one eye at a time, and move the chart nearer or further until the "O" to the side of the eye being used disappears from view...
That means when using your right eye, the "O" to your right will disappear when it's image on your retina is aligned with your optic nerve head and its physiological (normal) blind spot.
For your left eye, the "O" on your left will disappear...
You can also turn each chart 90 degrees to assess any effects on vertical versus horizontal contrast sensitivity sinusoidal waveforms...
Look for locally blurry, wavy, distorted or missing parts of any lines, and record the areas affected...
Cover but do not press on the other eye while using the chart with each eye...